Difference between revisions of "Edit scripts in Eclipse"
| Line 69: | Line 69: | ||
Almost all your scripts will access properties from Freeplane - the selected node (<tt>node</tt>), the controller (<tt>c</tt>), ... Such scripts need a running Freeplane instance of course. That's why debugging of scripts starts with starting Freeplane. This must happen from Eclipse and in a special way since otherwise Eclipse will neither know about the Freeplane instance nor about your script you want to test. | Almost all your scripts will access properties from Freeplane - the selected node (<tt>node</tt>), the controller (<tt>c</tt>), ... Such scripts need a running Freeplane instance of course. That's why debugging of scripts starts with starting Freeplane. This must happen from Eclipse and in a special way since otherwise Eclipse will neither know about the Freeplane instance nor about your script you want to test. | ||
| + | |||
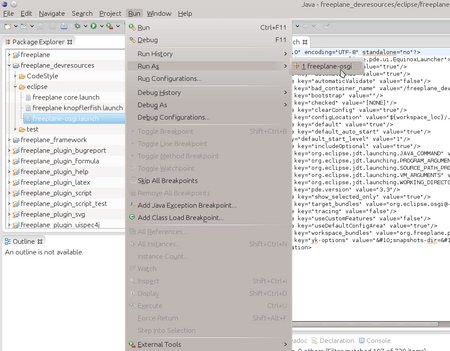
1. Open the file ''freeplane-osgi.launch'' via the ''Open resource'' command (Ctrl+Shift+R): | 1. Open the file ''freeplane-osgi.launch'' via the ''Open resource'' command (Ctrl+Shift+R): | ||
[[File:Eclipse-debugging1.png|300px|border]] | [[File:Eclipse-debugging1.png|300px|border]] | ||
| + | |||
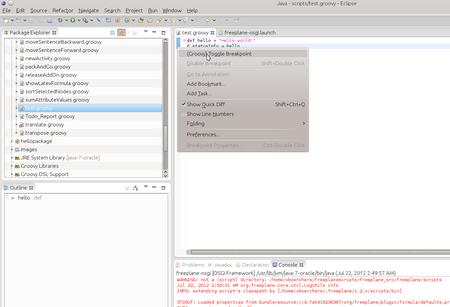
2. The file describes how a Freeplane instance can be launched from Eclipse. Use it this way: | 2. The file describes how a Freeplane instance can be launched from Eclipse. Use it this way: | ||
[[File:Eclipse-debugging2.png|450px|border]] | [[File:Eclipse-debugging2.png|450px|border]] | ||
| + | |||
3. Let's assume you want to debug a script called test.groovy. The script execution should be stopped before executing the second line of code. Therefore we have to set a "Breakpoint" at this line. In the lower part of the window you can see the "Console" window. It contains Freeplane's log output - very helpful in case of errors. - You don't have to visit to logfile to inspect error traces. | 3. Let's assume you want to debug a script called test.groovy. The script execution should be stopped before executing the second line of code. Therefore we have to set a "Breakpoint" at this line. In the lower part of the window you can see the "Console" window. It contains Freeplane's log output - very helpful in case of errors. - You don't have to visit to logfile to inspect error traces. | ||
| Line 87: | Line 90: | ||
[[File:Eclipse-debugging4.png|250px|border]] | [[File:Eclipse-debugging4.png|250px|border]] | ||
| + | |||
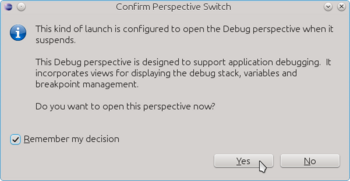
4. Then start the script in Freeplane. After some seconds Eclipse will get activated since the breakpoint in the script is hit. A dialog may appear: | 4. Then start the script in Freeplane. After some seconds Eclipse will get activated since the breakpoint in the script is hit. A dialog may appear: | ||
[[File:Eclipse-debugging5.png|350px|border]] | [[File:Eclipse-debugging5.png|350px|border]] | ||
| + | |||
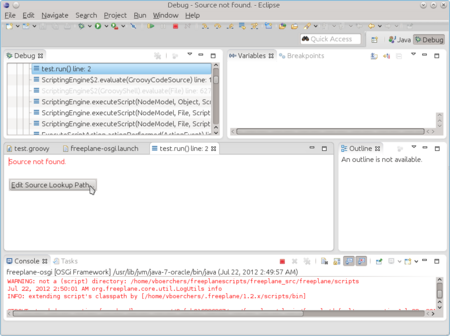
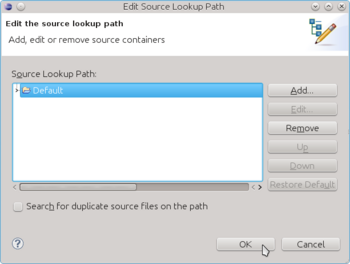
5. Eclipse doesn't know where to look for the sources of the script. Click on "Edit Source Lookup Path" | 5. Eclipse doesn't know where to look for the sources of the script. Click on "Edit Source Lookup Path" | ||
[[File:Eclipse-debugging6.png|450px|border]] | [[File:Eclipse-debugging6.png|450px|border]] | ||
| + | |||
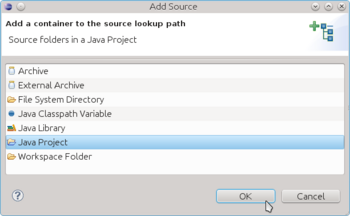
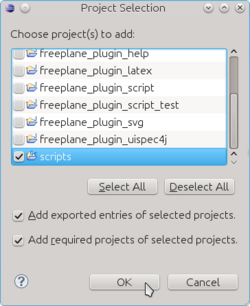
6. In the following dialog click on ''Add'' then follow the screen shots | 6. In the following dialog click on ''Add'' then follow the screen shots | ||
| Line 103: | Line 109: | ||
[[File:Eclipse-debugging9.png|250px|border]] | [[File:Eclipse-debugging9.png|250px|border]] | ||
| + | |||
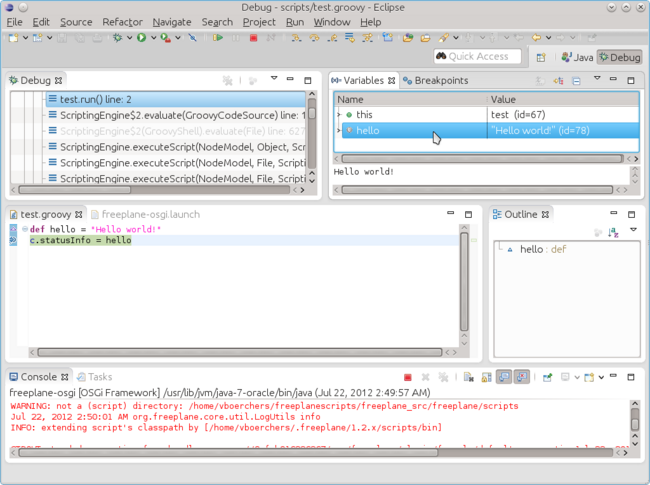
7. Finally the code line is displayed! In the "Variable" view in the upper right side corner you can inspect variables. For further instructions to use the Debugging perspective see the [http://www.vogella.com/articles/EclipseDebugging/article.html Eclipse debugging perspective]. | 7. Finally the code line is displayed! In the "Variable" view in the upper right side corner you can inspect variables. For further instructions to use the Debugging perspective see the [http://www.vogella.com/articles/EclipseDebugging/article.html Eclipse debugging perspective]. | ||
Revision as of 01:36, 22 July 2012
Contents
After the installation of the Scripting environment you can start editing scripts.
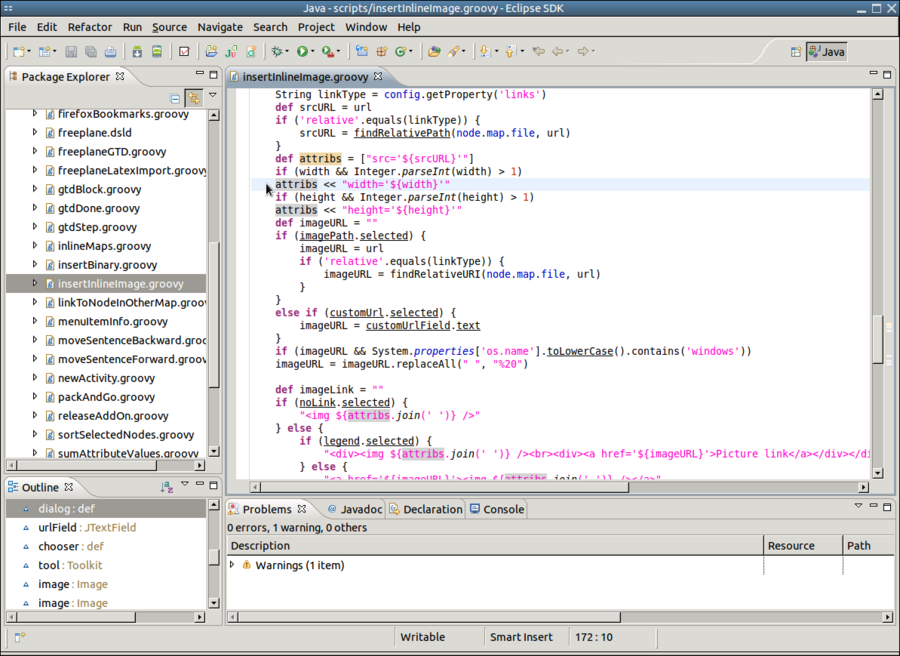
This is what it looks like after opening a script via Ctrl+Shift+R:
Code completion and quickfixes
Eclipse helps you quite a lot in avoiding and fixing errors. Here are some examples.
Let's assume that you have created a class in a file Hello.groovy that you want to use in another script: <groovy> package hellopackage
class Hello {
   def hello() {
       c.statusInfo = "Hello world!"
   }
} </groovy>
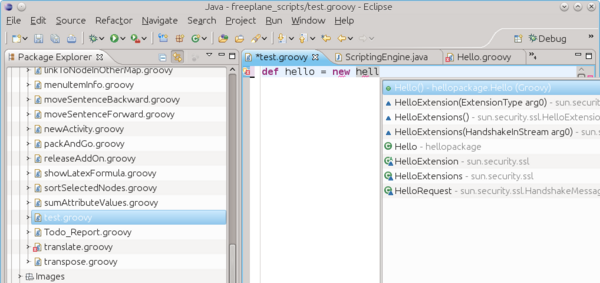
When we want to use class Hello we have to consider that it is defined in the package "hellopackage". Let's use Eclipse' editing aids to use it: After entering def hello = new hell hit Ctrl+Space
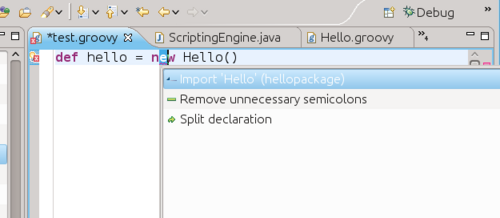
You will see that there is an error since the required "import hellopackage" is unfortunately not added automatically (as it is for imported Java classes). But the small red "x" indicates that a "Quick fix" is available which you can select either by clicking on the "x" or by hitting Ctrl+1
After selecting the first suggestion by hitting Enter you will be done:
My tip: Test what happens if you type Ctrl+Space whenever you think that Eclipse might have an idea what you are about to type. The idea is: You do the creative work and and Eclipse cares for the tedious details of exact naming and locating objects.
Magic keys
- Ctrl+Space
- Initiates content assist, completes typed texts.
- Import declarations for completed types are automatically added.
- Example: type "str" (without the quotes) and hit ALT space.
- F3
- Navigates to the definition of the variable/class under the cursor.
- This also works for Java and Freeplane classes - allowes to lookup details of the class.
- ALT+Cursor_Left
- Navigates to the last remembered location.
- Shift+Ctrl+T
- Open a type (e.g. a class or interface).
- Try entering "proxy" and select the Proxy from org.freeplane.plugin.script.proxy
- Proxy is the API definition.
- Shift+Ctrl+R
- Use this to open a script
- Ctrl+1
Making available groovy classes to your mind map
If in Eclipse you define and run Hello.groovy, Eclipse compiles and saves it as Hello.class in the build output folder you specified above. If you supplied a package name in the script e.g. package hellopackage, this name is used as a subdirectory, hellopackage/Hello.class. If you used the default (which it advised for scripts), it is just Hello.class.
- Open Freeplane and open Tools > Preferences > Plugins.
On the last row add the path to Eclipse' build output folder:
- If you followed the procedure above the build output folder is scripts/bin in the Freeplane user directory. In this case enter scripts/bin.
- If you have choosen some other directory (e.g. in the Eclipse workspace) you have to specify the full path.
In Windows 7 with non-English localization this has the following complication: Suppose the full path of the build output folder is shown in a Dutch Windows 7 as C:/Gebruikers/Beheerder/workspaceFP/scripts/bin then the script class path must be C:\Users\Beheerder\workspaceFP\scripts\bin since Windows 7 translates the real path C:\Users to Dutch C:\Beheerder. Furthermore note that all slashes MUST BE backslashes on Windows. You could avoid these complications by using the Freeplane script directory directly in Eclipse as described above.
- To take effect, restart Freeplane. (In case of problems, check the log file if Freeplane did could install the path).
Script debugging
Almost all your scripts will access properties from Freeplane - the selected node (node), the controller (c), ... Such scripts need a running Freeplane instance of course. That's why debugging of scripts starts with starting Freeplane. This must happen from Eclipse and in a special way since otherwise Eclipse will neither know about the Freeplane instance nor about your script you want to test.
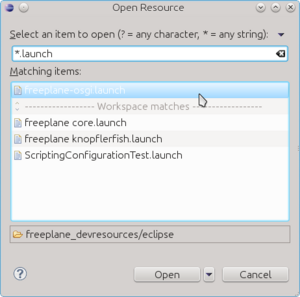
1. Open the file freeplane-osgi.launch via the Open resource command (Ctrl+Shift+R):
2. The file describes how a Freeplane instance can be launched from Eclipse. Use it this way:
3. Let's assume you want to debug a script called test.groovy. The script execution should be stopped before executing the second line of code. Therefore we have to set a "Breakpoint" at this line. In the lower part of the window you can see the "Console" window. It contains Freeplane's log output - very helpful in case of errors. - You don't have to visit to logfile to inspect error traces.
Open the context menu over the line with a right mouse click...
A faster way to add a breakpoint is by double clicking in the left bar before the line. The breakpoint is visualized as a small blue point:
4. Then start the script in Freeplane. After some seconds Eclipse will get activated since the breakpoint in the script is hit. A dialog may appear:
5. Eclipse doesn't know where to look for the sources of the script. Click on "Edit Source Lookup Path"
6. In the following dialog click on Add then follow the screen shots
7. Finally the code line is displayed! In the "Variable" view in the upper right side corner you can inspect variables. For further instructions to use the Debugging perspective see the Eclipse debugging perspective.
Enjoy!
